Demonstrative Video
Introduction
In sinusoidal circuit analysis, we learned to find voltages and currents in a circuit with a constant frequency source.
Keeping the amplitude of the sinusoidal source remain constant and vary the frequency, we obtain the circuit’s frequency response
Frequency response: complete description of the sinusoidal steady-state behaviour of a circuit as a function of frequency.
Many applications, such as communications & control systems.
Electric filters block out or eliminate signals with unwanted frequencies and pass signals of the desired frequencies.
Filters : radio, TV, and telephone systems to separate one broadcast frequency from another.
Transfer Function Representation
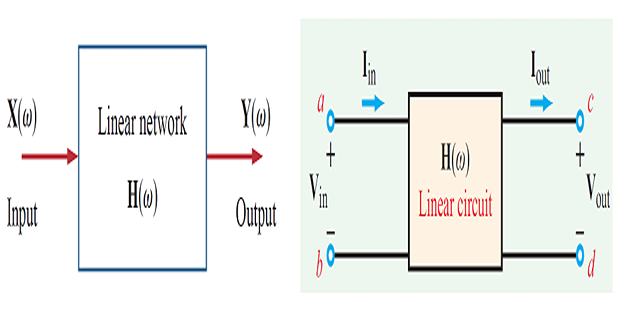
- Complex quantity\[\begin{gathered} \mathbf{H}(\omega)=M(\omega) e^{j \phi(\omega)} \\ M(\omega)=|\mathbf{H}(\omega)| \quad \text { and } \quad \phi(\omega)=\tan ^{-1}\left\{\frac{\mathfrak{Im}[\mathbf{H}(\omega)]}{\mathfrak{Re}[\mathbf{H}(\omega)]}\right\} \end{gathered}\]
Magnitude and Phase plots w.r.t frequency
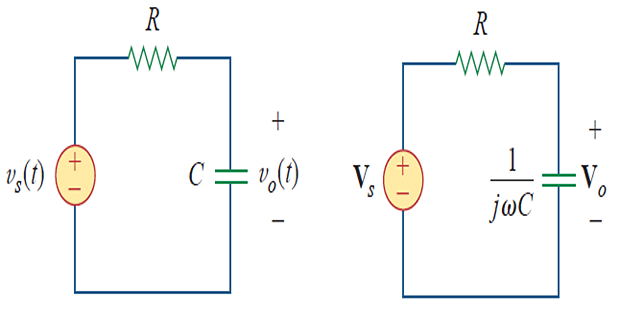
Frequency Response from TF
Obtain the TF \(V_o/V_s\) and its
frequency response if \(v_s = V_m \cos\omega
t\)
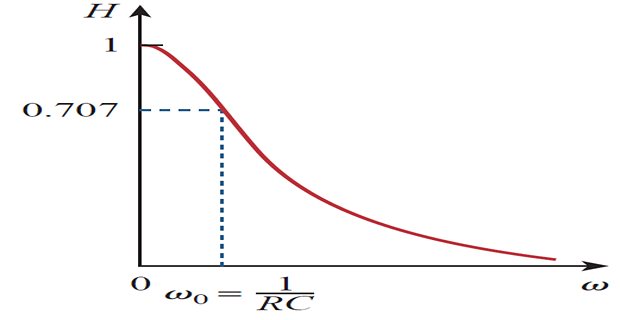
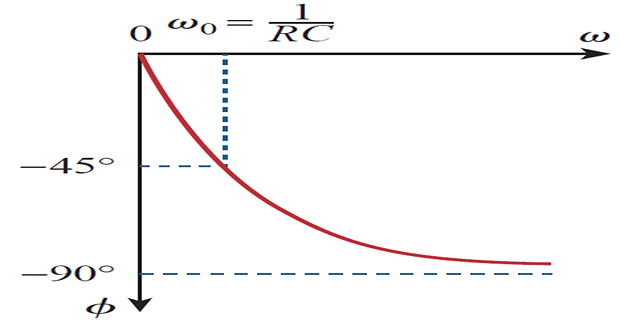
| \(\omega/\omega_0\) | \(\mathbf{H}\) | \(\mathbf{\phi}\) | \(\omega/\omega_0\) | \(\mathbf{H}\) | \(\mathbf{\phi}\) |
|---|---|---|---|---|---|
| 0 | 1 | 0 | 10 | 0.1 | -84\(^\circ\) |
| 1 | 0.71 | -45\(^\circ\) | 20 | 0.05 | -87\(^\circ\) |
| 2 | 0.45 | -63\(^\circ\) | 100 | 0.01 | -89\(^\circ\) |
| 3 | 0.32 | -72\(^\circ\) | \(\infty\) | 0 | -90\(^\circ\) |
The Decibel Scale
In communications systems, gain is measured in bels.
- The bel is used to measure the ratio of two levels of power or power gain\[\begin{aligned} G & = \text{Number of bels} = \log_{10}\dfrac{P_2}{P_1} \end{aligned}\]
The decibel (dB) provides us with a unit of less magnitude. It is \(1/10\) of a bel and is given by
\[\begin{aligned} &\boxed{G_{\mathrm{dB}} = 10 \log_{10}\dfrac{P_2}{P_1}} \end{aligned}\]Logarithms are greatly used because the reciprocal of a quantity is simply negative the logarithm of that quantity
\(10 \log_{10}\) is used for power while \(20 \log_{10}\) for voltage or current, because the square relationship exist (\(P = V^2/R = I^2R\)).
dB value is the logarithmic measurement of the ratio of one variable to another of the same type. Therefore, applies to TF.
Only voltage and current magnitudes are considered, negative signs and angles will be handled independently.
Bode Plots
Obtaining frequency response from the TF is a difficult task.
Systematic way of obtaining the frequency response is to use Bode plots.
Inconvenient to use a linear scale for the frequency axis as the range is very wide.
Semilogarithmic plots: the magnitude (dB) is plotted against the logarithm of the frequency; on a separate plot, the phase in degrees is plotted against the logarithm of the frequency
Bode plots are semilog plots of the magnitude (in decibels) and phase (in degrees) of a transfer function versus frequency.
Bode plots are easier to construct and contains all information as that of non logarithmic plots.